Policy Analysis
An LLM-driven policy classification and analysis pipeline with an interactive visual dashboard, tested on a large MOD policy document with hierarchical structure, cross-references, and content classification.
What it does
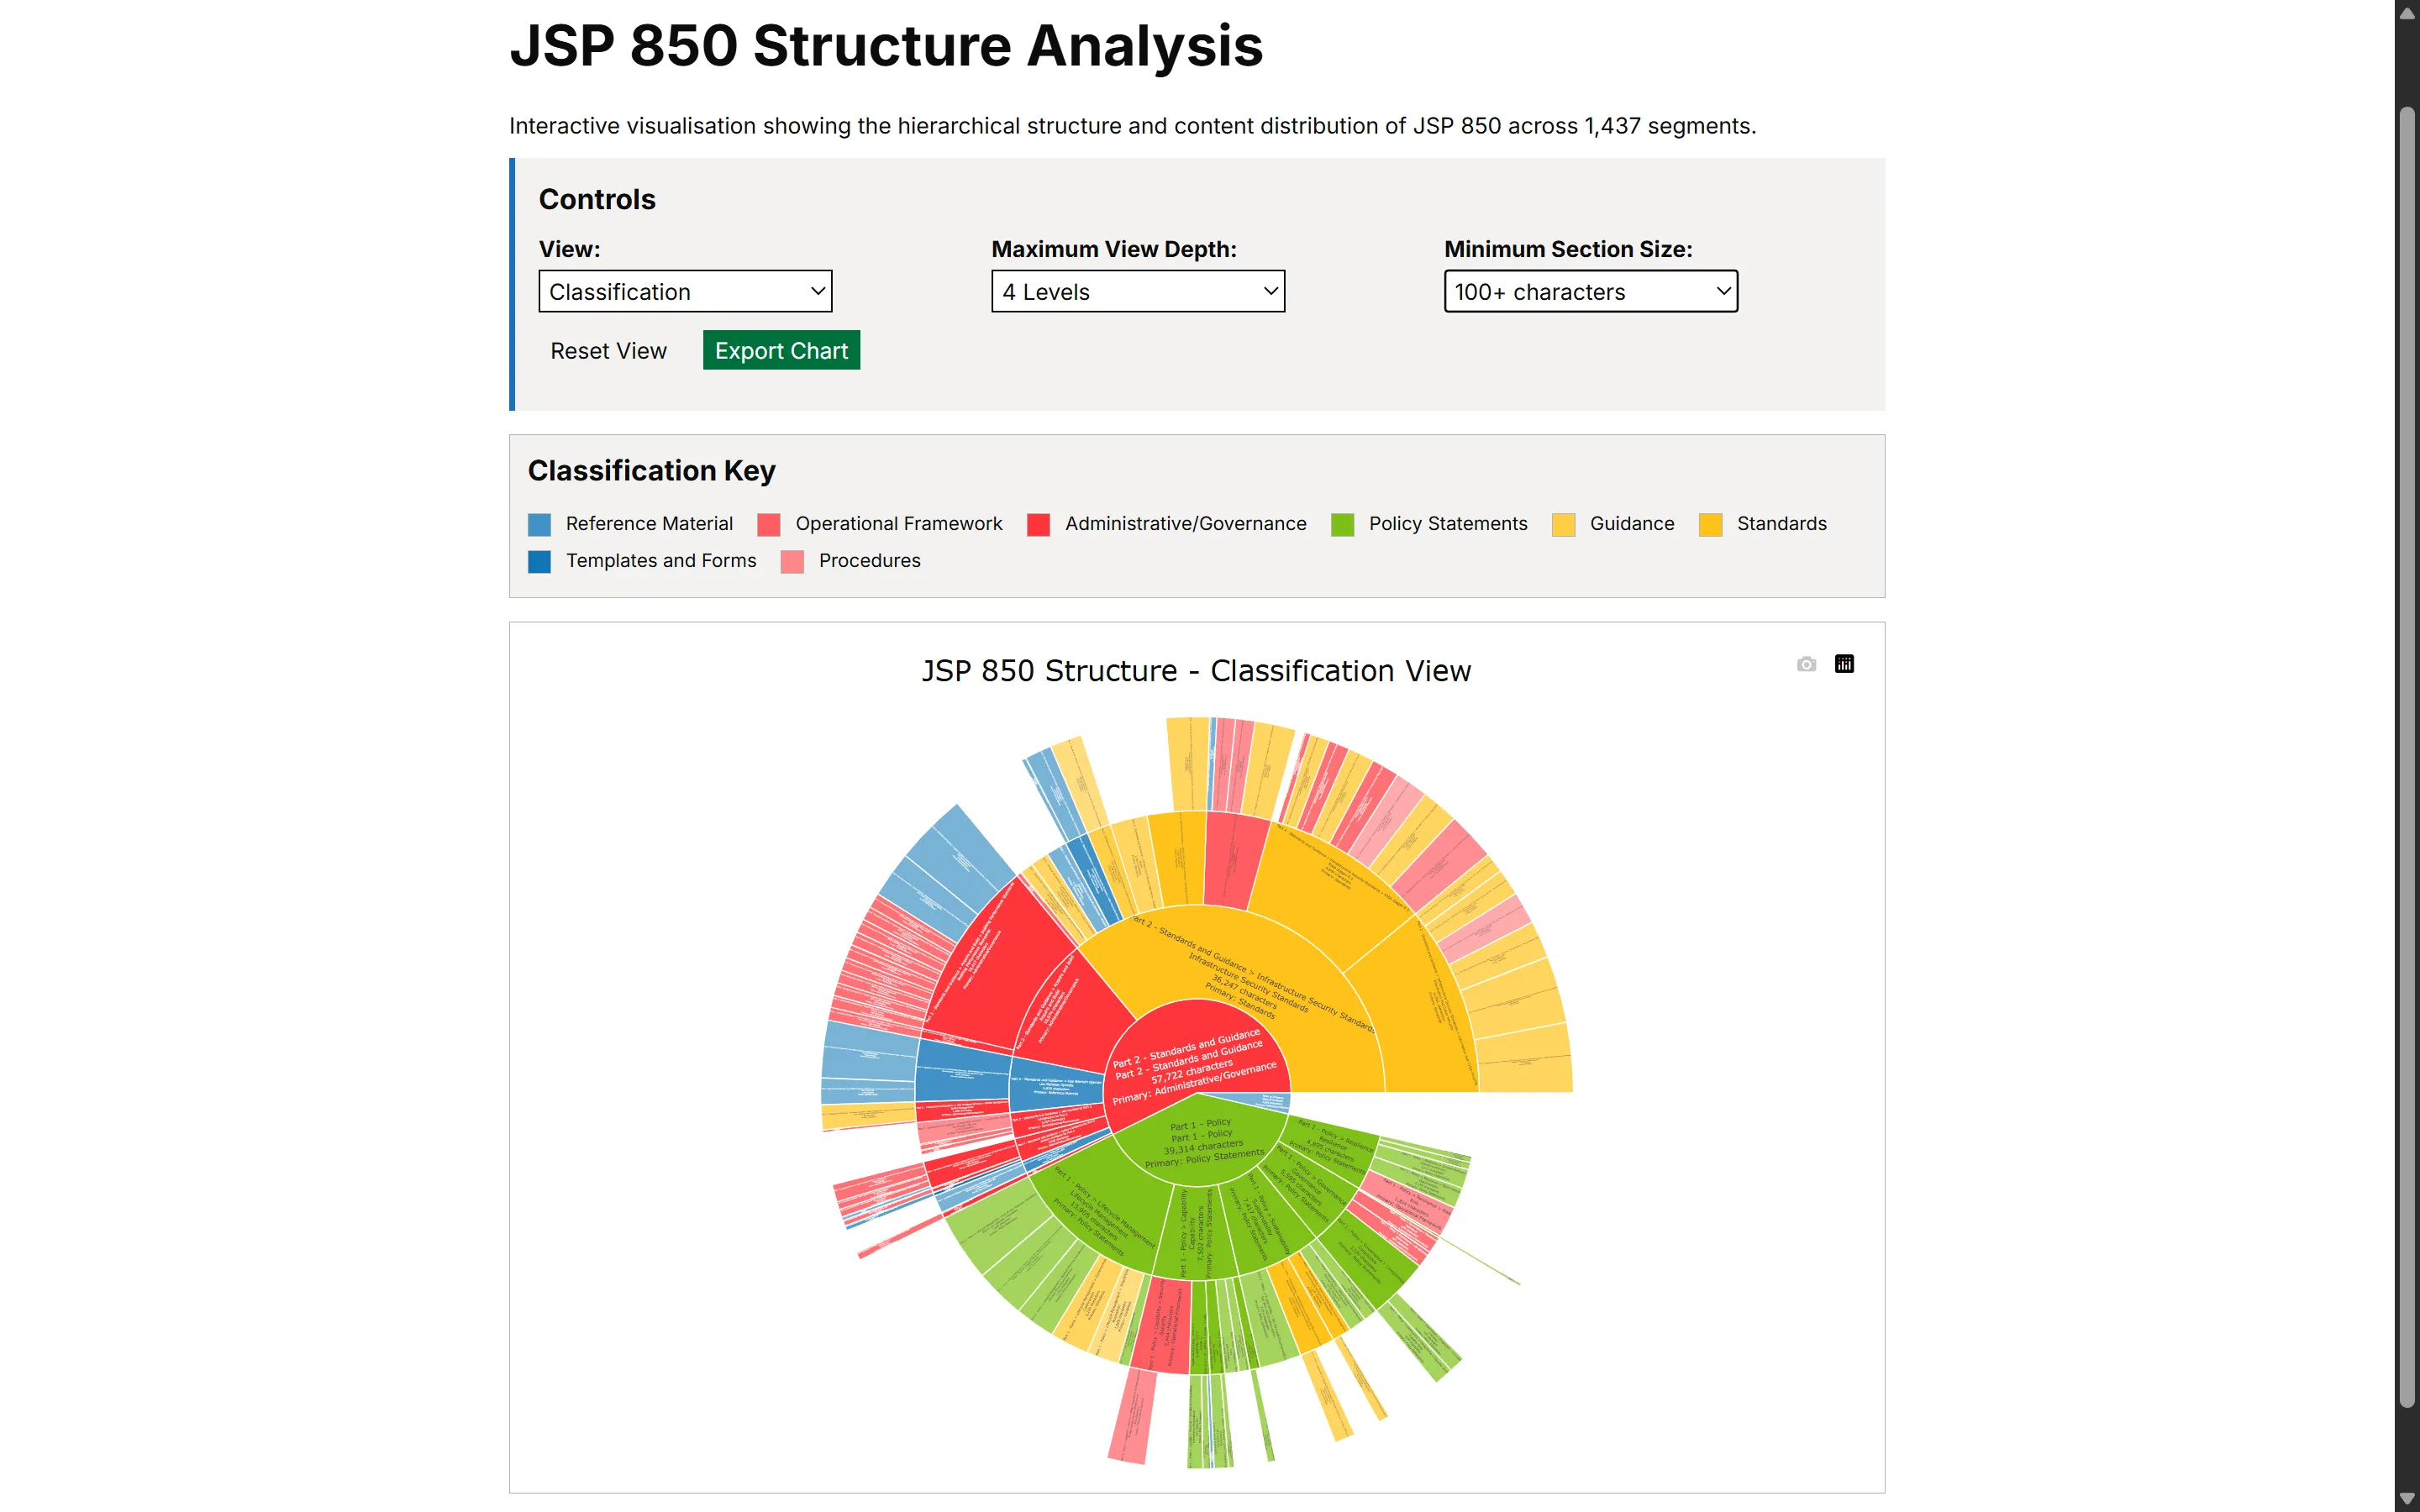
The pipeline and dashboard turns a single large, hierarchically-structured MOD policy document into something explorable rather than read start to finish: a sunburst chart shows how content is distributed across the document’s section hierarchy and classification types (policy statements, standards, guidance, procedures, and so on), and Sankey diagrams trace how sections reference each other, at whichever level of the hierarchy the user chooses to look at.
How it works
A parsing algorithm reads the source document into a flat table—one row per section. The Claude batch API is then used to classify each prompt with detailed instructions, and output a structured JSON response. From there, several purpose-built dashboards render different views onto the same underlying data: a sunburst for hierarchical content distribution, a treemap as an alternative view onto the same structure, and Sankey diagrams at multiple zoom levels for reference flow. Each dashboard exports to a single self-contained HTML file with the data embedded directly in it, so it opens in any browser with no server or Python environment required.
The interesting problem
The issue was turning a diverse document with a range of content types into a sensibly structured dataset to perform analysis on. This is the perfect task for an LLM, but the size of the document made it impossible to do in one pass. Instead, the LLM was fed approximately 1,400 semantic chunks, together with their surrounding context.
Stack and why
Plotly/Dash was chosen for the interactive exploration work during development, but the final deliverable exports to static, standalone HTML—embedding the processed data directly in the page—so the dashboards can be handed to someone without a Python environment and still work exactly the same way.
Stack
- Python (pandas)
- Parsing the document's heading hierarchy (up to seven levels deep) and cross-references into structured tabular data
- Claude batch API
- Classification of document content, output to JSON
- Plotly / Dash
- Interactive sunburst, treemap and Sankey visualisations of document structure and reference flow
- Static HTML export
- Standalone, server-free dashboard files (GOV.UK-styled) for distribution without a Python environment
- Repository—private repository